
The novel coronavirus outbreak has demonstrated the value of simulations and models. Political leaders have relied heavily on model predictions to make critical decisions about social distancing, business closures, quarantines, and the like. Dr. Anthony Fauci, director for the National Institute of Allergy and Infectious Diseases, has been a key proponent of using models and simulations in developing strategies to counter the pandemic. Taylor Hatmaker notes, “A deeply-respected authority on viral diseases, Fauci assisted in guiding the federal response to SARS, MERS, Ebola and now the novel coronavirus.”[1] When President Trump wishfully projected the U.S. would emerge from the crisis by Easter, the models used by Dr. Fauci convinced the President to keep important social distancing guidelines in place. Dr. Fauci provided the President with model results that “estimated that the U.S. may see between 100,000 and 200,000 deaths from COVID-19, the deadly disease caused by the novel coronavirus.”[2] According to Arman Azad, government officials reviewed over a dozen different statistical models to reach their conclusions.[3]
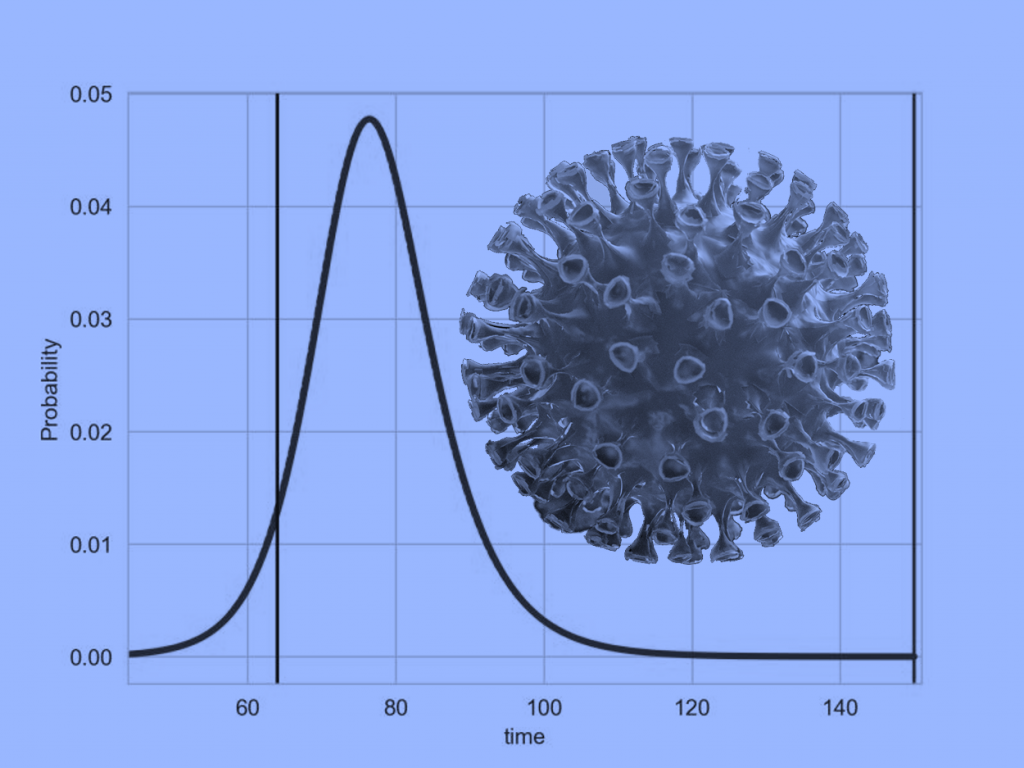
Caleb Bastien, Chief Science and Technology Officer at Massive Dynamics, writes, “Forecasting epidemics is not too dissimilar to forecasting hurricanes. Both are phenomena driven by non-linear differential equations with sensitive dependence on initial conditions. Being dynamic models, predictions are updated each day based on the new data.”[4] He continues, “With collaborator Grzegorz A. Rempala we created a method called dynamic survival analysis (DSA), whereby we discovered a new mathematical equation for epidemics over networks.” They explain their work in a paper entitled “Throwing Stones and Collecting Bones: Looking for Poisson-like Random Measures.” Using their method, they predicted infection density for the U.S. from 27 March 2020 (i.e., day 64 of the crisis, indicated by blue line) forward to day 148 (i.e., the predicted end of the epidemic). Bastien writes, “As can be seen, we are in the rapidly increasing phase, with a ‘peak’ infection density around day 77 [7 April].”
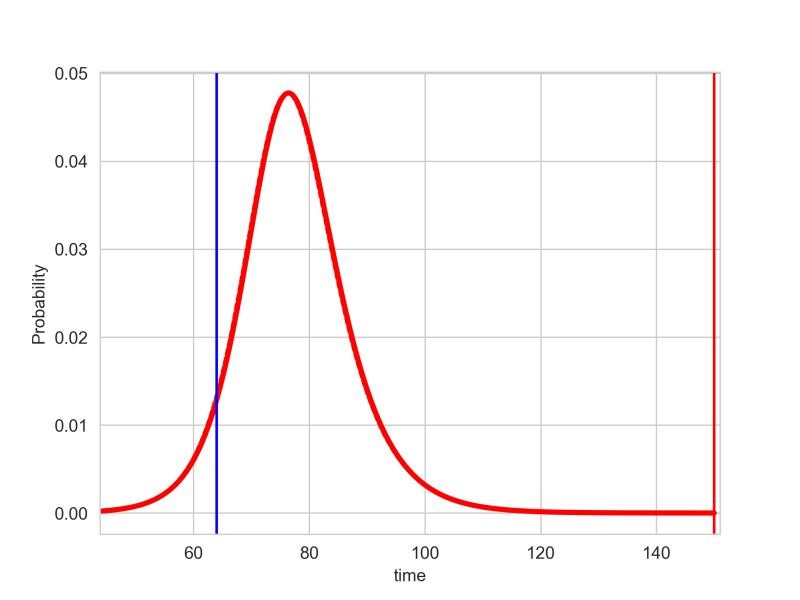
Of course, the country as a whole does not follow a single predictive model. Peak infection densities will be different depending on when the novel coronavirus first infects a specific area. The objective of social distancing and other measures is to flatten the curve and spread out the onset of peak densities. If you are interested in taking a deeper dive into Bastien’s and Rempala’s work, you can watch an hour-long video by Rempala discussing their collaboration. The Abstract to Rempala’s discussion states: “As the outbreak of COVID-19 in the city of Wuhan appears to be the beginning of a global pandemic, there is much public interest in predicting both the dynamics and the size of the ongoing regional outbreaks in different countries. It is also important to ascertain the potential effects of early interventions such as school closures and mandatory or self-imposed quarantines. To answer some of these questions, we propose a general framework for analyzing the ongoing outbreak trend using data from a partially observed epidemic curve under minimal assumptions that are clearly specified. In particular, this framework does not assume any specific infectious or recovery periods (which are often unknown) or observable prevalence of the disease (allowing, for instance, for silent infectives). We show that this analysis can help anticipate both the likely temporal trends of an ongoing epidemic as well as its final size in a community with or without social distancing.”
Martin Enserink (@martinenserink) and Kai Kupferschmidt (@kakape) observe, “With COVID-19, modeling takes on life and death importance.”[5] They explain, “COVID-19 isn’t the first infectious disease scientists have modeled — Ebola and Zika are recent examples — but never has so much depended on their work. Entire cities and countries have been locked down based on hastily done forecasts that often haven’t been peer reviewed.” That’s why government officials are using so many models on which to base decisions. John Blyler (@JohnBlyler) believes mathematics behind the models is important. He writes, “A simple lesson in the math behind coronavirus COVID-19 predictions increases the appreciation for self-isolation and social distancing.”[6] He continues, “Predictive models help health professionals and government agencies decide when and where to apply resources to stop or lessen the devastating economic and health effects of communicable diseases like COVID-19. But it’s important for the general population to appreciate the basic math that makes these predictions possible.” His explanation follows:
“Population growth of viruses and many other natural phenomena are modeled using a logistic or S-shaped curve. Such curves represent an exponential function that is used in math to model growth. In simpler terms, exponential growth means that the number of cases of infected people doubles for a given time period. With the COVID-10 outbreak, that doubling occurs on average every two or three days. This doubling also pertains to the rate of the number of fatalities. No virus can grow at an exponential rate forever. Virus growth is bounded by available resources, such as uninfected hosts, transmission medium, nutrients, water, etc. Still, the initial exponential growth of viruses do increase at an alarming rate. For COVID-19, we know the number of infected people doubles every 2 to 3 days. To be conservative, let’s choose a 3-day doubling period. If there were 1000 confirmed COVID-19 cases today and the number was 500 cases three days ago, then the infection rate doubles every three days. As long as the deaths are doubling at a constant rate, the growth is exponential. This means that the original 500 cases will grow to more than 1 million cases after 11 doubling times or 3 days x 11 = 33 days (roughly one month). Fortunately, this type of infectious growth rate doesn’t continue infinitum. As the growth rate peaks and begins to fall, the curve changes from an exponential one to a normal distribution or bell curve.”
Modeling isn’t the only way cutting edge analytics can help detect and mitigate the effects of a serious disease. Eric Niiler (@eniiler) reports an AI-powered monitoring service provided the first indication of the coming Covid-19 pandemic. He writes, “On January 9, the World Health Organization notified the public of a flu-like outbreak in China: a cluster of pneumonia cases had been reported in Wuhan, possibly from vendors’ exposure to live animals at the Huanan Seafood Market. The US Centers for Disease Control and Prevention had gotten the word out a few days earlier, on January 6. But a Canadian health monitoring platform had beaten them both to the punch, sending word of the outbreak to its customers on December 31. BlueDot uses an AI-driven algorithm that scours foreign-language news reports, animal and plant disease networks, and official proclamations to give its clients advance warning to avoid danger zones like Wuhan.”[7]
The point is, companies have tools available to them to not only provide early warning but to provide real-time decision-making tools and systems that can help them prepare for post-crisis recovery. Steve Banker (@steve_scm), Vice President of Supply Chain Services at ARC Advisory Group, recommends companies establish war rooms to deal with such crises. “Clearly,” he writes, “digital war rooms could be useful for multinationals that want to explore a multitude of scenarios and be better able to respond under different conditions. There are several technologies that it would be sensible to have in these war rooms.”[8] My two companies, Enterra Solutions® and Massive Dynamics™, are working on tools to help corporate war rooms make better decisions. Banker concludes, “When it comes to risk management, many companies learn the hard way.” The novel coronavirus pandemic is a great time to tackle current challenges as well as prepare for the next crisis.
Footnotes
[1] Taylor Hatmaker, “Fauci: US can expect more than 100,000 COVID-19 deaths, millions of cases,” TechCrunch, 29 March 2020.
[2] Ibid.
[3] Arman Azad, “Model cited by White House says 82,000 people could die from coronavirus by August, even with social distancing,” CNN, 31 March 2020.
[4] Caleb Bastien, LinkedIn post, 30 March 2020.
[5] Martin Enserink and Kai Kupferschmidt, “With COVID-19, modeling takes on life and death importance,” Science Magazine, 27 March 2020.
[6] John Blyler, “Doing the (Coronavirus) Math: Exponentials, Bell Curves and Flattening,” Design News, 25 March 2020.
[7] Eric Niiler, “An AI Epidemiologist Sent the First Warnings of the Wuhan Virus,” Wired, 25 January 2020.
[8] Steve Banker, “Multinationals Need COVID-19 War Rooms,” Logistics Viewpoints, 30 March 2020.