Every school child learns that there has been an explosion of knowledge over the last 150 years. Richard C. Atkinson, President of the Nagasaki University of Foreign Studies, asserts, “We are living in an age of unprecedented intellectual discovery, an era in which knowledge doubles every 12 to 15 years in the sciences alone.” Aristotle may have been the last man who could claim that he knew most of what was knowable in most areas of learning. Today, it is simply impossible to keep up with new discoveries, even if your specializing. Brian Hindo, writing in BusinessWeek, reports how software is helping people working in similar fields keep track of what is going on [“Mapping the Crowd,” 15 November 2007].
“Keeping track of the dizzying proliferation of information in the Digital Age can overwhelm managers, and sizing up potential alliances can be daunting. But getting lost can be a costly setback for those with valuable ideas they want to develop. Maps—specifically, intellectual property maps created by strategic advisers Boston Consulting Group—increasingly are being used by everyone from health-care companies to research scientists. They’re deploying them to better manage, and expand, the networks they want to cultivate. By mapping links among people and corporations issuing patents and conducting research on common problems, BCG’s software tool can bring to light ways to achieve breakthroughs. Being able to map which scientists communicate—and how often—could help managers focus on new areas of research.”
My friend, Tom Barnett, and I have insisted for a long time that good things happen when connections are made. We are also proponents of good visualization. People intuitively understand pictures better than words.
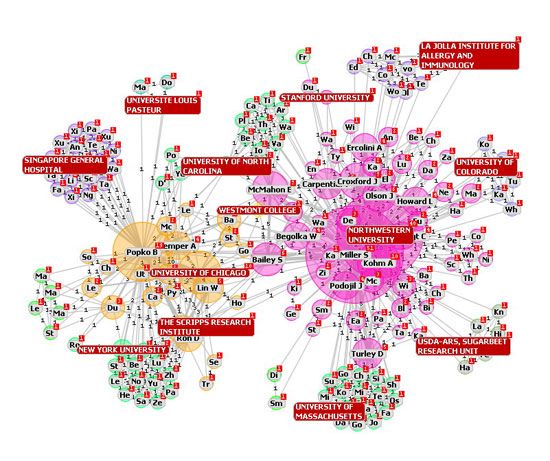
“The BCG mapping software conducts keyword searches of patent and scholarly databases. Unlike other data trawlers, such as Google’s patent search, the firm’s tool arranges the data in the form of a map with circles and connecting lines, quickly illustrating which organizations are working on similar technologies and which researchers are citing a company’s patents. Companies and people show up as circles—the bigger the circles, the greater the amount of work those companies are doing in fields related to the keywords. Research or patent citations are shown on the map as links between circles.” [See attached image as an example of what is being described.]
Hindo reports that companies and organizations are using BCG mapping software to help find partners and increase collaboration. He uses a non-profit organization as an example of how this works.
“The Myelin Repair Foundation (MRF), for example, a Saratoga (Calif.) nonprofit, pulls together scientists from various disciplines to research treatments for multiple sclerosis (MS). When MRF founder Scott Johnson, a BCG alumnus, first organized his team of five principal investigators in 2003, he used the network mapper to see how the researchers’ work was interconnected. Johnson’s team used the software, provided pro bono by BCG, to search medical databases for about 56 different compounds or proteins that are important to MS treatment. The resulting map showed the five MRF researchers and their labs as prominent circles, which represented the many scientific papers they published about the compounds. But there were only a few thin lines connecting the circles, indicating the researchers were largely working alone and rarely citing each other’s work. With a topographical view of their interactions, Johnson has pushed the scientists to work together more often. As a result, the latest map shows the intertwined work of Stephen Miller, an immunologist at Northwestern University, and Brian Popko, a University of Chicago geneticist. Their circles didn’t connect on the initial 2003 map. But as the current one shows, they’re citing one another and co-authoring papers often. ‘They’ve become quite interdependent over the years,’ says Russell Bromley, MRF’s chief operating officer. ‘Brian has ended up having Steve work with him on projects that are more immunological in nature…and Steve has worked with Brian on projects that really are coming out of his genetics work.'”
I’m a big believer in strategic partnerships and alliances. It is a waste of time and effort to duplicate something that someone else is already doing. I pride myself on being able to recognize when another company does something well that complements what my company wants to do. Normally, a win-win situation can be found so that neither time nor resources are wasted. The BCG mapping software helps companies find potential collaborators in places they might not have otherwise looked. That is what MRF uses it for.
“Organizing such a vast array of information in a visual way allows MRF managers, for example, to peek at hard-to-find technologies. MS causes inflammation in the brain and spinal cord, so the team uses the tool to find out what’s happening in inflammation research broadly, uncovering the work of unfamiliar scientists in adjacent fields. Without it, Bromley says, the foundation would have to cast its nets the old-fashioned way, asking colleagues haphazardly at conferences or doing a laborious manual search of the literature. He says using the map has shaved years off the process.”
That is the power of connectivity in the information age. Hindo concludes his article with another valuable use of mapping involving intellectual property.
“Another kind of payoff may come when an intellectual property map is used to shape strategy. Companies can detect early-stage rivals that are working on new technologies, for example. When BCG deploys the software, one goal is to discover “promising white spaces,” or blank areas where clients can find opportunities, says Wendi Backler, who runs the firm’s work in intellectual property and networking. BCG used mapping to help a health-care company seeking to grow through acquisitions—the company had identified only one potential target. A search of patent keywords brought up hundreds more that flew beneath the client’s radar. Backler recalls another company struggling to grow. It looked at a map of patent activity in its industry and saw a field of circles representing each of its rivals, with lines connecting one another like a constellation. The client showed up as a lonely little dot in the lower corner of the map, like a Facebook user with no friends. The lesson: It was isolated in a networked world.”
Connectivity and visualization are extremely important in the information age. Any product that improves both should be a winner. BCG’s clients seem to agree.