Back in 2009, IBM made news with its announcement of System S software that could “suck up huge volumes of data from many sources and quickly identify correlations within it.” [“I.B.M. Unveils Real-Time Software to Find Trends in Vast Data Sets,” by Ashlee Vance, New York Times, 20 May 2009] The “S” in the name of the software stood for “stream processing.” Vance reports that IBM “spent close to six years working on the software.” Back then, the big data label had yet to be attached to such software, but people were nonetheless talking about the growing mountains of data that needed to be analyzed in real time. “Instead of creating separate large databases to track things like currency movements, stock trading patterns and housing data,” Vance reported, “the System S software can meld all of that information together. In addition, it could theoretically then layer on databases that tracked current events, like news headlines on the Internet or weather fluctuations, to try to gauge how such factors interplay with the financial data.”
I looked for some follow-up information on System S, but could only find a background paper written in 2008. When I asked an IBM “live chat” representative about the software, he indicated that “the announced System S did not become a product category. It evolved into other products such as super computing and Stream computing for the software side.” The most likely contender, the representative noted, was a product call IBM InfoSphere Streams. The IBM web site notes, “Part of IBM’s platform for big data, IBM InfoSphere Streams allows you to capture and act on all of your business data… all of the time… just in time.” As you can see, IBM eventually jumped on the “big data” bandwagon. On another web page, IBM describes big data this way:
“Everyday, we create 2.5 quintillion bytes of data–so much that 90% of the data in the world today has been created in the last two years alone. This data comes from everywhere: from sensors used to gather climate information, posts to social media sites, digital pictures and videos posted online, transaction records of online purchases, and from cell phone GPS signals to name a few. This data is big data. Big data spans three dimensions: Variety, Velocity and Volume.
- Variety – Big data extends beyond structured data, including unstructured data of all varieties: text, audio, video, click streams, log files and more.
- Velocity – Often time-sensitive, big data must be used as it is streaming in to the enterprise in order to maximize its value to the business.
- Volume – Big data comes in one size: large. Enterprises are awash with data, easily amassing terabytes and even petabytes of information.
“Big data is more than a challenge; it is an opportunity to find insight in new and emerging types of data, to make your business more agile, and to answer questions that, in the past, were beyond reach. Until now, there was no practical way to harvest this opportunity.”
IBM, of course, is trying to sell companies its big data solutions. According to Shara Tibken, IBM “has spent more than $14 billion on more than two-dozen analytics-related acquisitions over the past five years.” She indicates that IBM “expects to generate $16 billion in revenue from the market by 2015.” [“IBM Seeks Bigger Stake In Big-Data Analytics,” Wall Street Journal, 24 October 2011] Of course, IBM is not alone in big data analytics sector. For example, my company, Enterra Solutions, is also in the big data analytics business along with many others. Enterra focuses primarily on supply chain solutions. According to Cliff Saran, “Data analytics represents a massive opportunity for IT.” [“What is big data and how can it be used to gain competitive advantage?” Computer Weekly, August 2011] He explains:
“The McKinsey Global Institute recently published a report on the opportunities in business and government of using big data. According to McKinsey, the use of big data is becoming a key way for leading companies to outperform their peers. ‘We estimate that a retailer embracing big data has the potential to increase its operating margin by more than 60%. We have seen leading retailers such as Tesco use big data to capture market share from local competitors, and many other examples abound in industries such as financial services and insurance,’ the report says. A study from IBM shows that companies which excel at finance efficiency and have more mature business analytics and optimisation can experience 20 times more profit growth and 30% higher return on invested capital.”
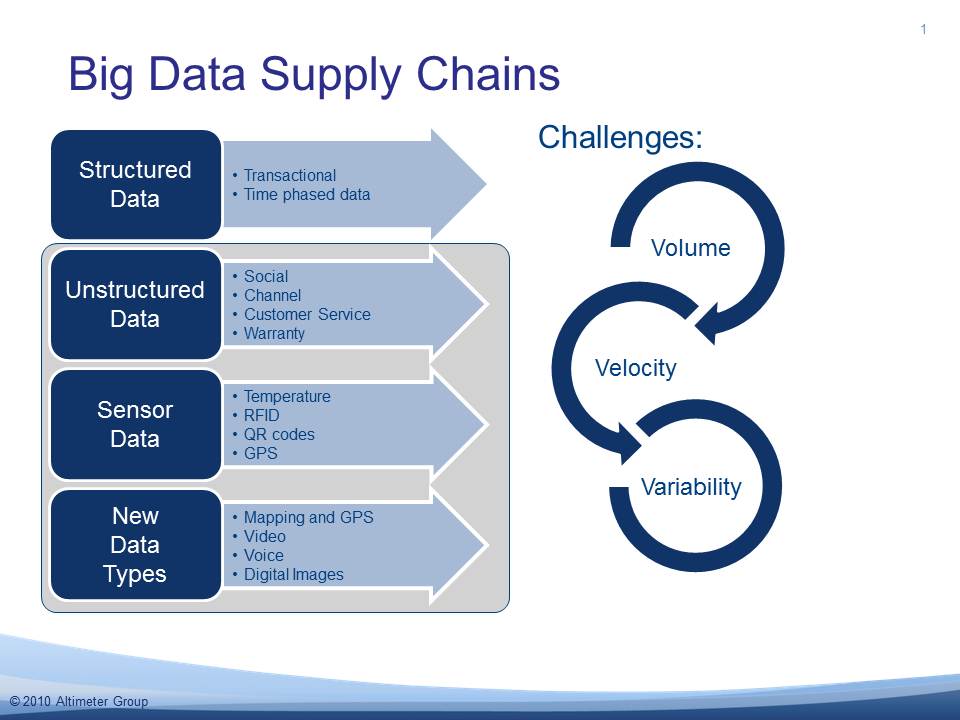
Noted supply chain analyst Lora Cecere agrees with Saran that big data analytics is the current “it” (i.e., the next big thing) in information technology. [“The “it” that needs to be in IT,” Supply Chain Shaman, 11 October 2011] She agrees with IBM that big data involves volume, velocity, and variability. She depicts the kinds of data that must be analyzed in the following graphic.
She writes:
“Today’s supply chain needs to be able to sense and respond across ALL of these data types. For supply chain management it is the ‘it’ in IT (information technology). Yes, we have entered the era of BIG DATA supply chains. It is a world where the volume, and the velocity of data has exploded. While companies have successfully scaled to handle transactional volumes, the other data types mentioned above combined with enrichment data –content, weather, location, maps, voice, video, digital images–can enable new capabilities to sense and respond more intelligently.”
Based on the discussion to this point, you probably recognize that big data analysis is not easy and that technologies are just now emerging to make such analysis easier. Saran acknowledges that there are challenges associated with big data analytics. He writes:
“The biggest problem, according to Quocirca analyst Clive Longbottom, is that the type of data businesses have to manage is changing. ‘More and more binary large objects (BLOBs) are appearing in the database, and these require different approaches [to analyzing rows and columns] to be able to identify and report on what the content actually is and in identifying patterns and making sense out of what this means to the user,’ says Longbottom. … Mark Beyer, a research director at Gartner, warns that big data will cause traditional practices to fail, no matter how aggressively information managers address dimensions beyond volume. … Gartner … identifies 12 dimensions of big data, split into quantification, access control and qualification. He says the analysis of data becomes complex: ‘Data does not have to be 100% accurate. If I cannot look at all the data, I need to do sampling.’ Gartner uses the term ‘linked data’ to describe a data quality process when sampling large data volumes. The report defines linked data as data from various sources that have relationships with each other and maintain this context so as to be useful to humans and computers. … MapReduce is another aspect of big data. If a large country builds a smart electricity grid with billions of meters to detect power usage, the meters would send huge amounts of data to those monitoring the health of the grid, Gartner notes. But most readings would amount to ‘noise’ because nearly all would simply report normal operation. Gartner says a technology such as MapReduce can perform a statistical affinity or clustering analysis by moving the initial processing to the meters to gather similar readings together. An analyst can then specify that the system should filter out readings within normal parameters and display only abnormal readings. This type of processing cuts down on the actual data volume being transmitted.”
Brian Hopkins, an analyst with Forrester, estimates “that firms effectively utilize less than 5% of available data.” He believes that big data analysis is going to separate winners from also-rans in the years ahead. [“Big Data Will Help Shape Your Market’s Next Big Winners,” Brian Hopkins’ Blog, 30 September 2011] He concludes:
“Every once in a while, a company will do something that rapidly elevates it to the top of its market. Walmart optimized its supply chain, drove down prices, and smacked its competition. Google, Yahoo, and Facebook used big data to deal with web scale search, content relevance, and social connections, and we see what happened to those markets. If you are not thinking about how to leverage big data to get the value from the other 95%, your competition is. In this information age, the firms that best turn information to their advantage will dominate their competition. And big data will play a big part in helping them do it.”
The best big data analytical systems will be those that manage to sort the noise from the important data in an efficient and effective way. That’s not as easy as it sounds. If some “noise” doesn’t get through, then the filtering mechanisms are probably set to tightly and important data could be missed. If too much noise gets through, users will lose confidence in the system. This is an exciting area that will likely see a number of breakthroughs in the years ahead.